
by Dennis Harter
dennish@isb.ac.th
Last week ISB hosted a parent session focused on understanding the external assessments that are used by ISB, along with how to understand the scoring systems used by those tests.
The presentation included some slides that don’t make much sense without the context, so this article will present the key slides along with text to explain what the significant points.
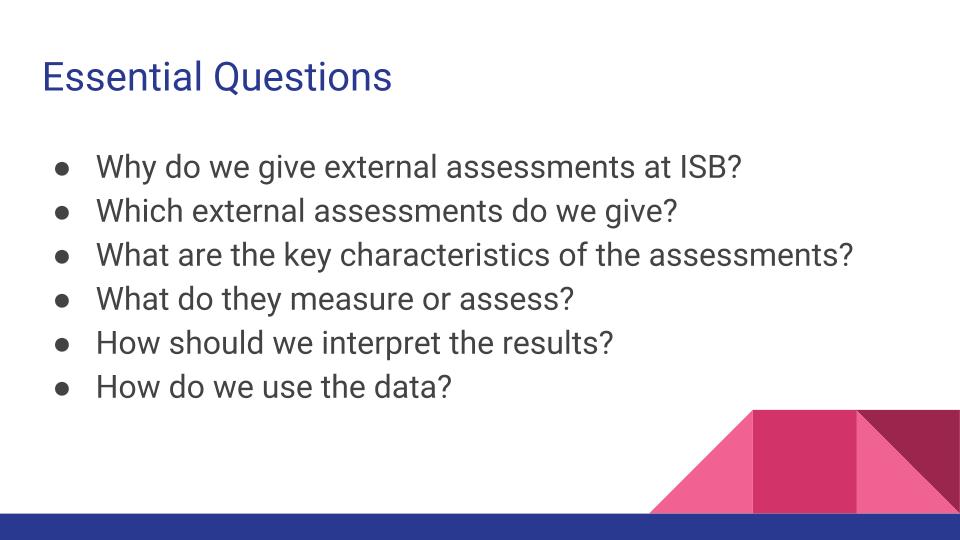
We started with some the essential questions of our presentation.
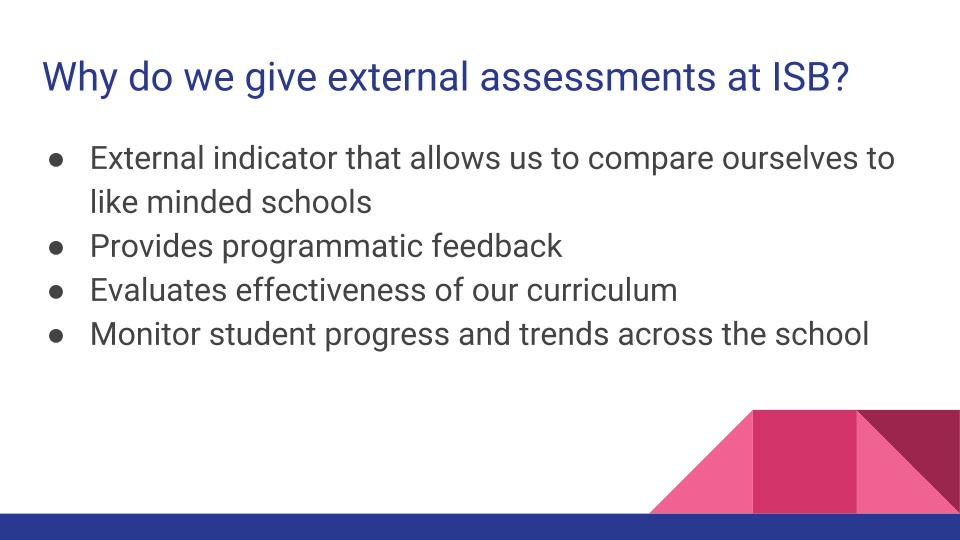
We then discussed the reasons we use external assessments at ISB. It’s important to remember that these “scores” represent ONE assessment and snapshot of a moment in time. They are subject to how the child was feeling that day, whether other stressors existed, and usually have a wide band of error.
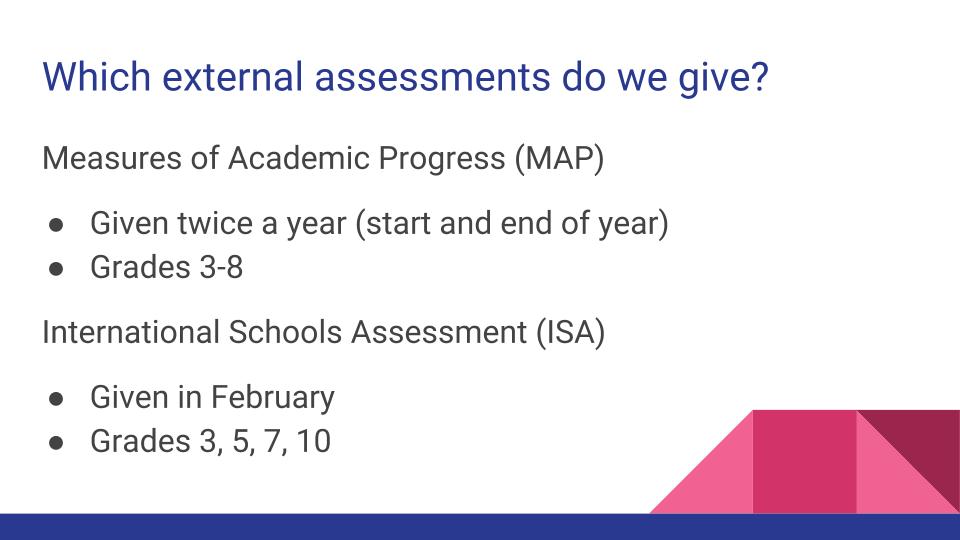
At ISB, we offer the MAP and ISA assessments at different grade levels:
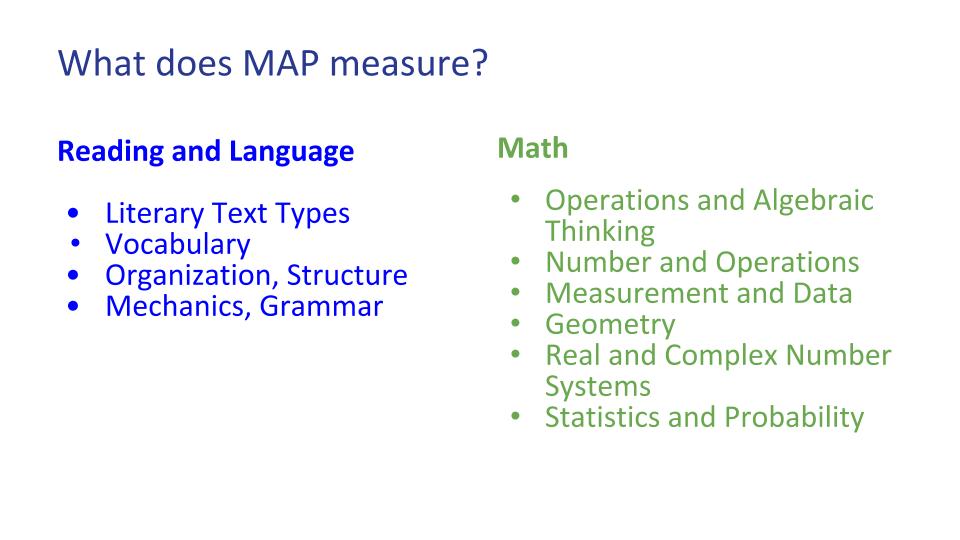
The key characteristics of the MAP test are:
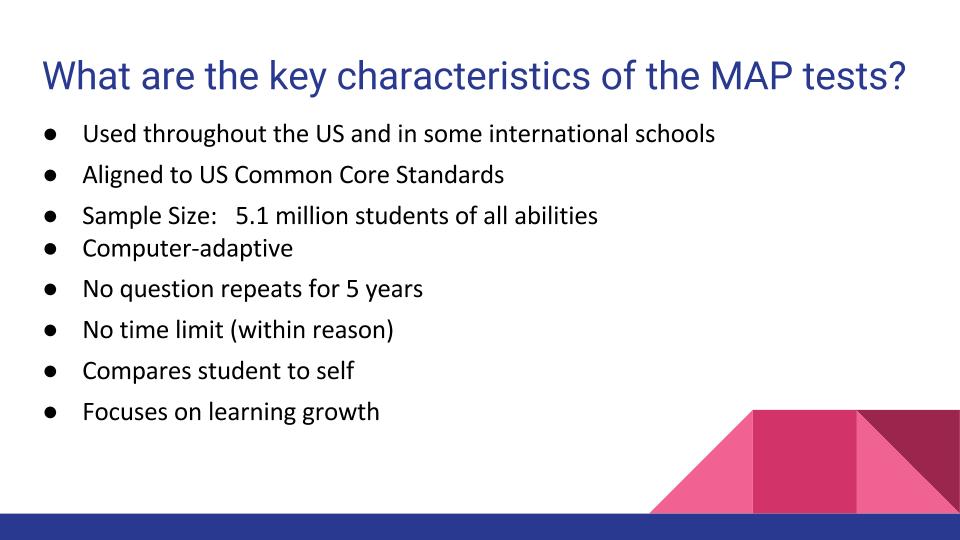
The MAP tests, published by the NWEA, tests in Reading and Mathematics.
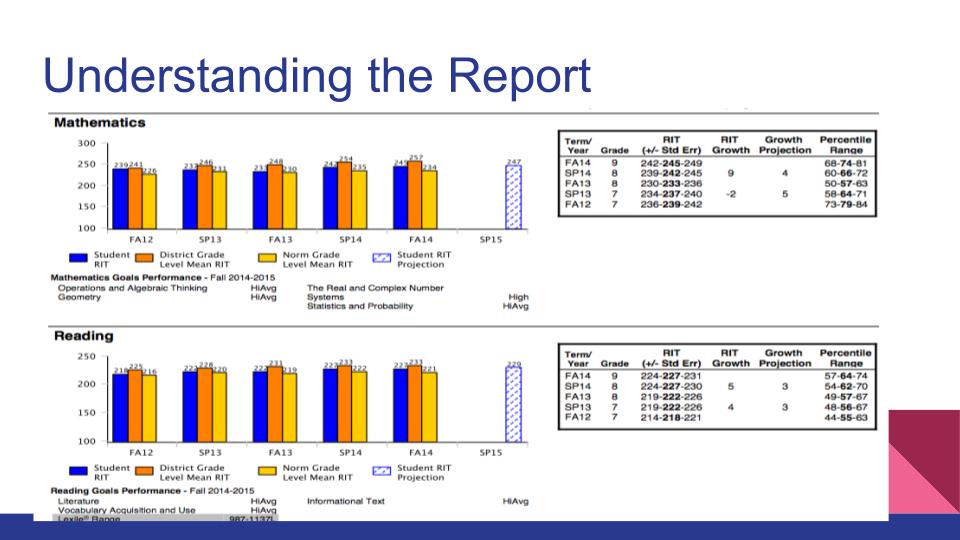
After all students have completed the computer based test, a score report is made available to students/parents. The report includes both a RIT score – a measurement indicating point totals from questions answered correctly based on their level of difficulty – and a Percentile – the percentage of which a students fared better than other test takers (for example 83rd percentile means 82 of 100 students scored lower than this student).
Also helpful in understanding the report are the projected growth vs actual growth. The projected growth represents what growth typically happens for scores at this level. It is worth noting that the RIT scores have a band of error on either side which can have quite a large range.
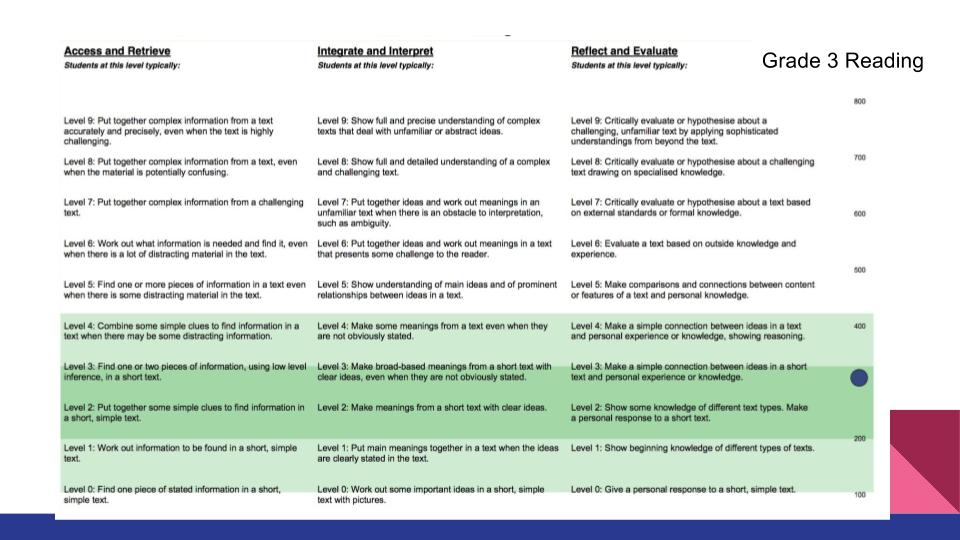
We also offer the ISA test, which is developed by ACER in Australia. This test is taken by ISB students in grades 3, 5, 7, and 10. In grade 10, the results can be compared against the well-known PISA test which is taken to compare countries’ education systems around the world.
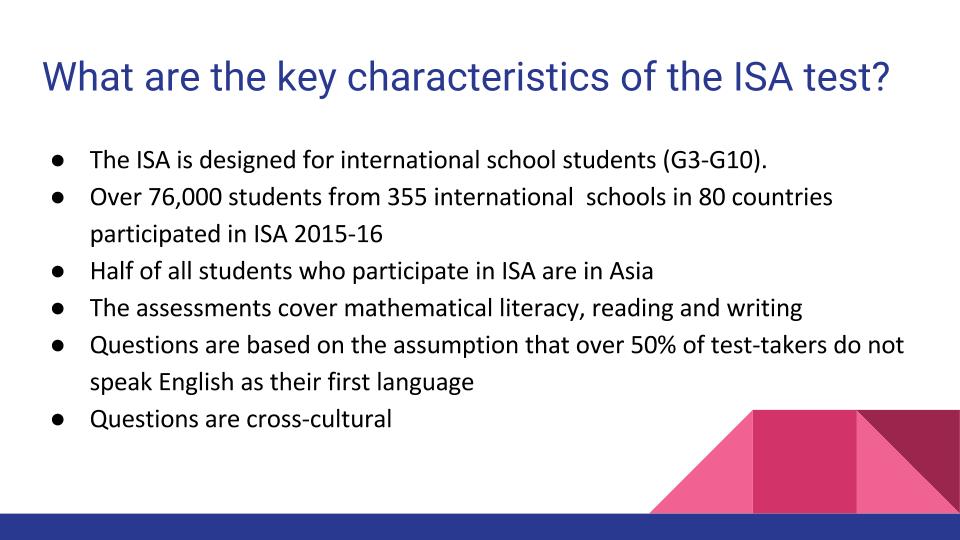
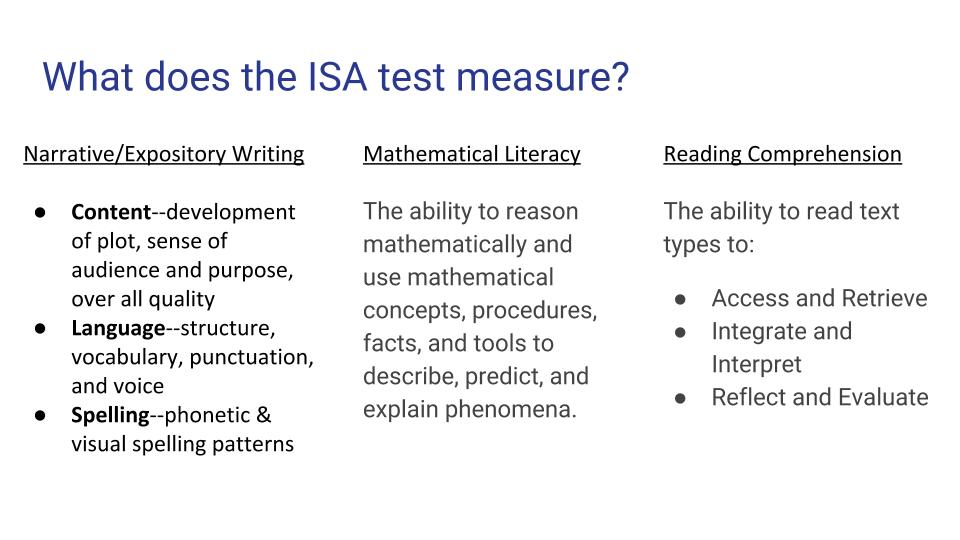
The ISA assessment includes testing in Reading, Math, and two forms of Writing (narrative and expository).
 The ISA score report provides a dot where the student scored along with two bands of color. The darker band represents the range for which the middle 50% of scores fell. The lighter band represents the range for the middle 90%.
ISB uses these external assessments as a gauge of program. The individual scores also provide us with a single data point about the child at that given time. In the diagram below, you can see where external assessments fit in the larger scheme of evaluating a student’s attainment.
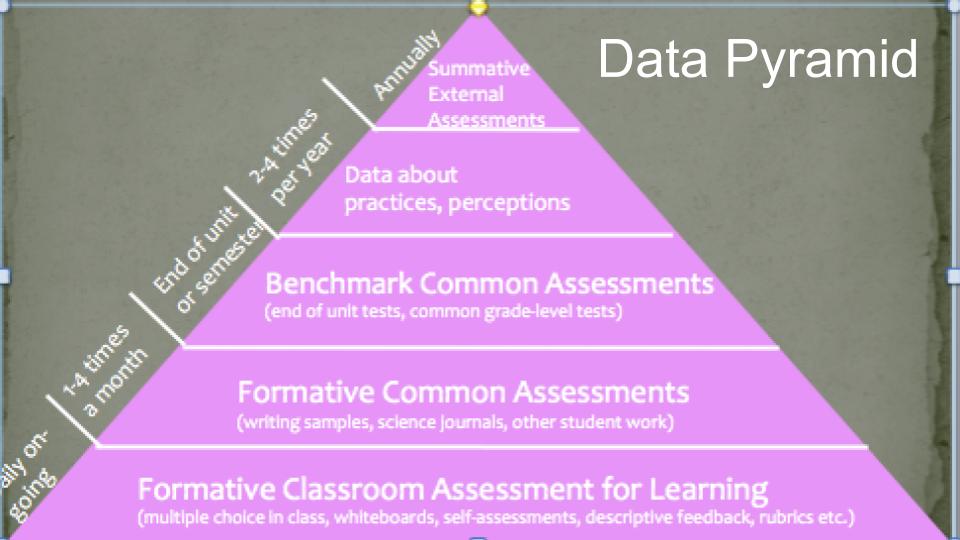
It’s important that we remember that external assessments are only one data point. Students learn and develop at different rates and in different ways. The external scores represent a very specific moment in time, as well.
If you have further questions about the MAP or ISA tests, please feel free to contact your divisional administration.